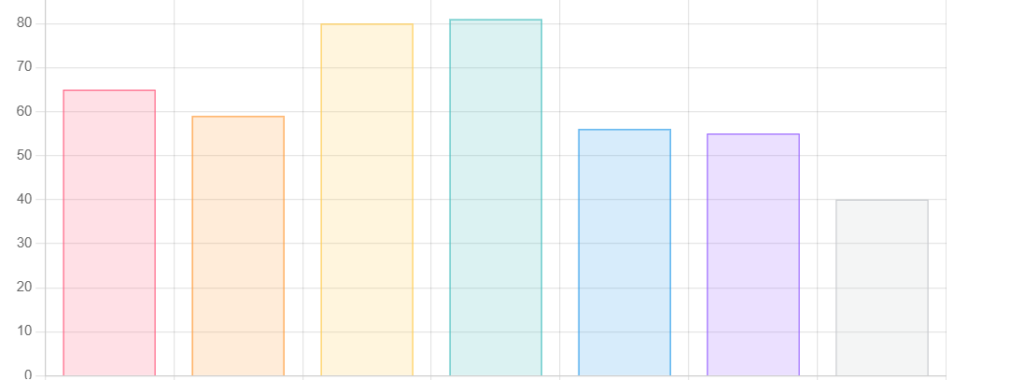
Are you ready to elevate your web development game? Dive into the fascinating world of Angular, ChartJs and TypeScript as we explore the seamless integration of these powerful tools. This comprehensive guide will not only demystify the complexities but also empower you to create visually stunning and interactive charts for your web applications.
Contents
Introduction: Unleashing the Potential of Angular, ChartJs and TypeScript
In the fast-evolving realm of web development, harnessing the capabilities of cutting-edge technologies is paramount. Angular, coupled with Chart.js and TypeScript, presents a formidable trio that can revolutionize your data visualization game. Let’s embark on a journey to understand the synergy between these technologies and unlock their full potential.
What is Chart.js
- Chart.js is a free open-source JavaScript library
- Used Data visualization
- Supports 8 chart types
Bar
Line
Area
Pie
Bubble
Radar
Polar, and scatter.
Installation
Chart.js can be installed via npm or bower.
Npm
npm install chart.js –save
Bower
bower install chart.js –save
How to create Organization Bar Chart using Chart.js and Type Script
BarChart.ts File

import { Component, OnInit } from '@angular/core';

import { Chart } from 'chart.js';

import { CustomerService } from '../../Service/customer.service';

import { SalesData } from '../../Models/SalesData';

@Component({

  selector: 'app-ang-chart',

  templateUrl: './ang-chart.component.html',

  styleUrls: ['./ang-chart.component.sass']

})

export class AngChartComponent implements OnInit {

  BarChart = [];

  ItemDesc = [];

  SalesAmount = [];

  SalItemData : any[];

  IsBarChart: boolean = true;

  constructor(private customerService: CustomerService, private salesDtl: SalesData) { }

  ngOnInit() {

    this.customerService.getSalesDetails().subscribe(data => this.SalItemData = data);

  }

}

loadBarChart() {

    this.ItemDesc = [];

    this.SalesAmount = [];

//Get Data From API

    this.customerService.getSalesDetails().subscribe(data => {

      for (let dt of data) {

        this.ItemDesc.push(dt.ItemDescription);

        this.SalesAmount.push(dt.Qty);

      }

      this.BarChart = new Chart('barChart', {

        type: 'bar',

        data: {

          labels: this.ItemDesc,

          datasets: [{

            label: 'Number of Items Sold',

            data: this.SalesAmount,

            barPercentage: 0.5,

            barThickness: 50,

            maxBarThickness: 50,

            minBarLength: 0,

            borderColor: "red",

            backgroundColor: "royalblue",

          }]

        },

        options: {

          title: {

            text: "Bar Chart",

            display: true

          },

          scales: {

            yAxes: [{

              ticks: {

                beginAtZero: true

              }

            }]

          }

        }

      });

    });

  }

BarChart.html File

<table>

  <tr>

   <td>

      <div>

        <input type="button" (click)="loadBarChart()" value="Bar chart" id="btnBarChart">

      </div>

    </td>

  </tr>

</table>

<br><br>

<div>

  <table border="1">

    <tr>

      <th>Item Description</th>

      <th>Qty</th>

    </tr>

    <tr *ngFor="let trData of SalItemData">

      <td>

        {{ trData.ItemDescription}}

      </td>

      <td>

        {{ trData.Qty}}

      </td>

    </tr>

  </table>

</div>

<br><br>

<div [hidden]="!IsBarChart" class="chart-container" style="position: relative; height:20vh; width:40vw">

  <canvas id="barChart" width="400" height="300"></canvas>

</div>
ChartJs and TypeScript